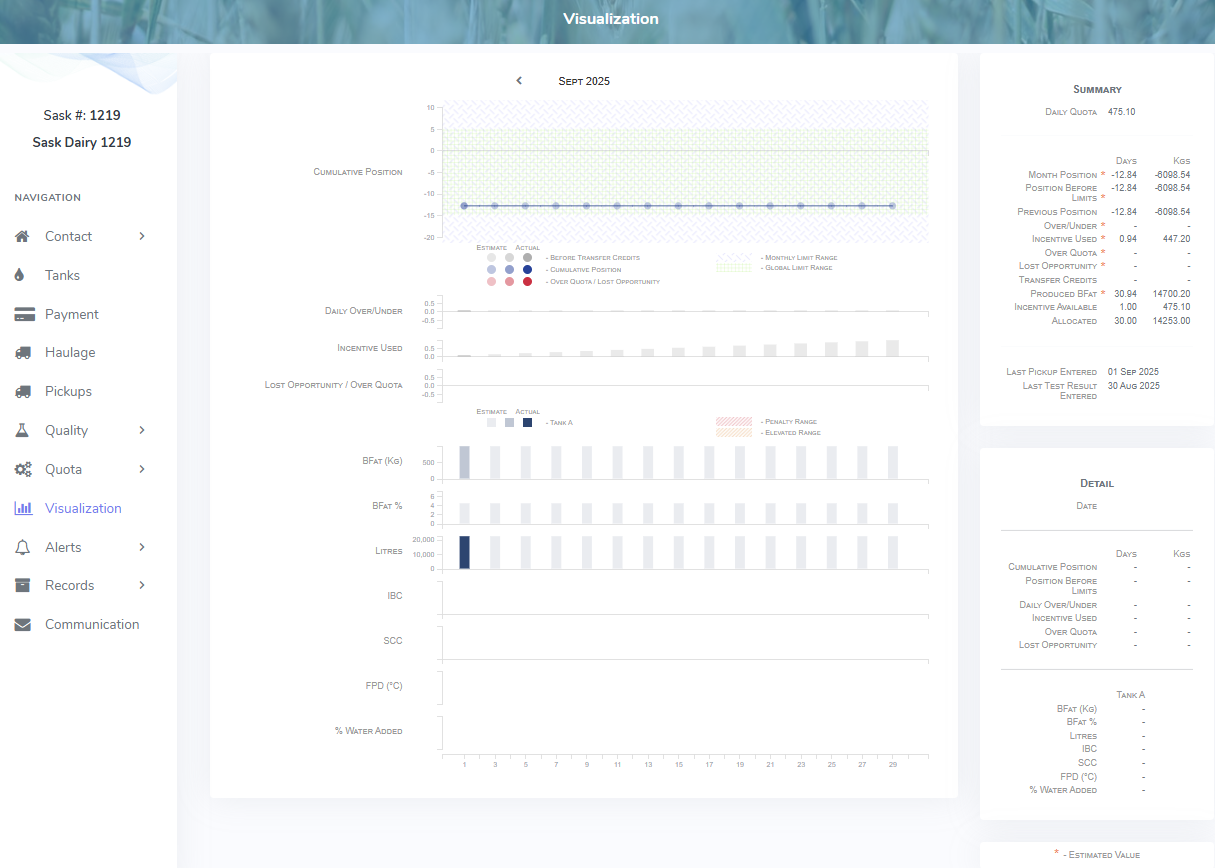
The Visualization page displays graphically the cumulative position, daily over/under, lost opportunity/over quota, and milk components for the month selected.
 Note: For those months not completed, the visualization forecasts based on the current production to date.
To open the Visualization page from the Producer Dashboard page:
•Click Visualization on the navigation bar.
•Click the left arrow next to the Month and Year to view the previous month visualization or click the right arrow to proceed to the next month's visualization.
The Visualization page provides:
•Ability to view graphically the cumulative position, daily over/under, lost opportunity/over quota, and milk components for the month selected
•Ability to view previous months
•Ability to hover over or click a date on the graphic to display the details of an individual day in the month's components and position