The Provincial Quality Averages Search page lets administrators view milk quality data in tables or as graphs compared to provincial benchmarks. Charts display producer test results over time, with reference lines for provincial averages, helping identify unusual values—like high MUN or butterfat levels—and ensuring milk quality stays within standards.
To open the Provincial Quality Averages Search page from the Producer Dashboard page:
•Click the Quality arrow on the Navigation bar and then select Provincial Quality Results.
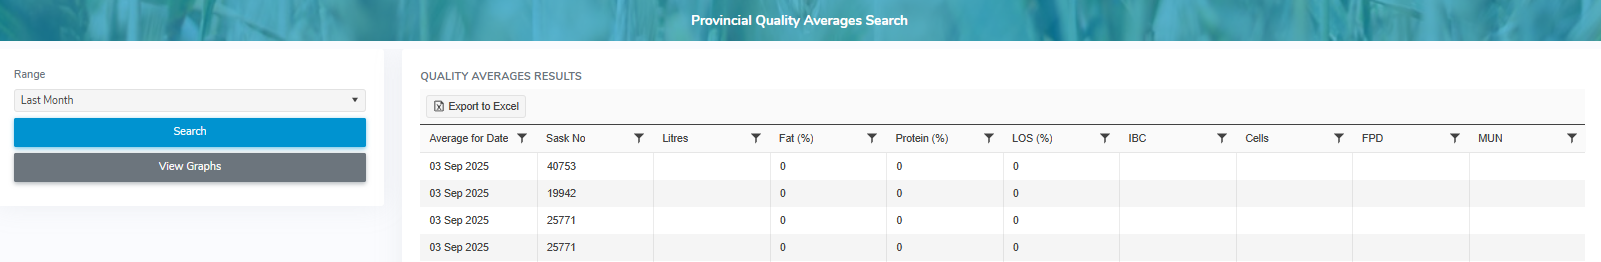
The Provincial Quality Averages Search page provides:
•View of the penalties by date sampled, lab test date, Sask #, route, results, voilation #, and penalty type
•Ability to search by start date and/or end date, Sask #, barn #, and quality type
•Ability to view graphs of the results selected
•Ability to filter and sort column details in ascending or descending order
•Ability to export result details