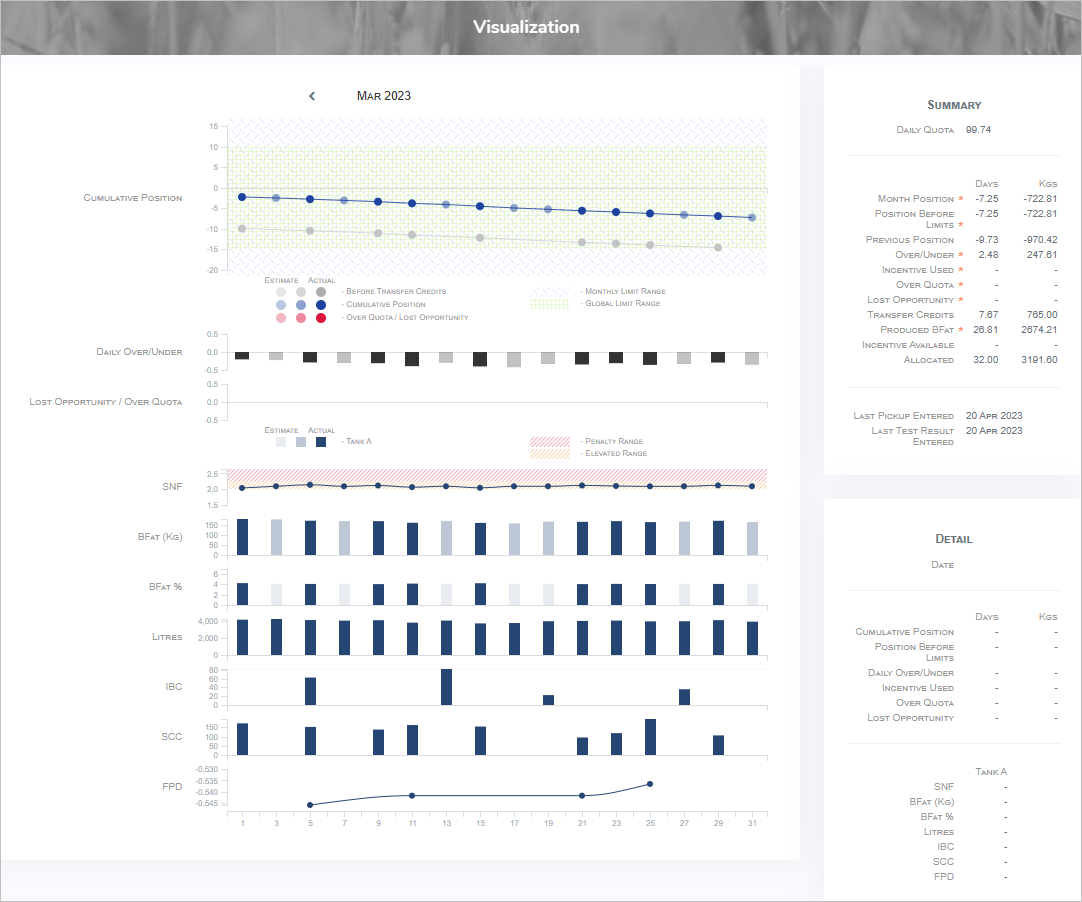
The Visualization page provides a visual representation of the producer's production for the selected month.
To open the Visualization page from the Dashboard page:
•Click Visualization on the menu bar.
The Visualization page provides:
•View of producer contacts and designations of authority
•Ability to proceed to different month views