The Quality page displays the quality test results for each pickup and identifies any samples that fall within the penalty, warning, or unsuitable ranges. Graphs provide a visual summary of the current data.
To open the Quality page from the Dashboard page:
•Click the Quality arrow on the menu bar and then select Special Quality.
The Quality page provides:
•Ability to view all recent messages
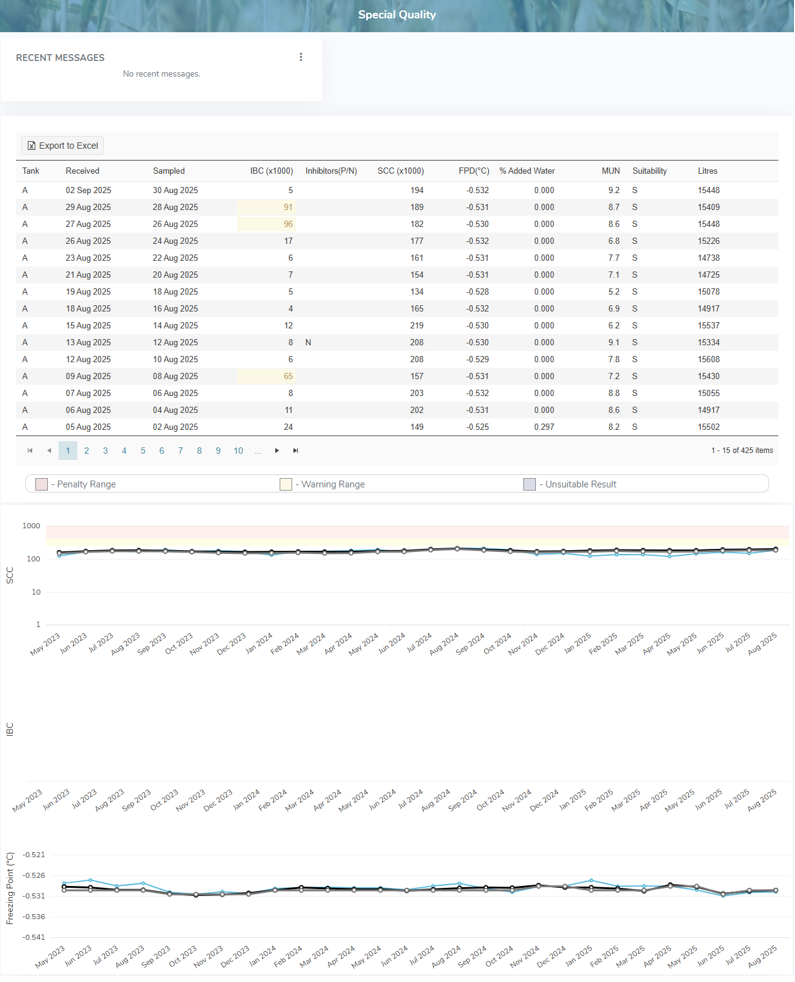
•View list of the lab tests taken and completed on the tank including information for IBC (x1000) Individual Bacteria Cells (IBC) per litre, Inhibitors (P/N), SCC (x1000) Somatic Cell Count (SCC) per litre, Freezing Point (°C), percentage added water, MUN Milk Urea Nitrogen, Suitability, and total litres as well as an indicator of any penalty range, warning range, or unsuitable result values.
•Ability to sort column details in ascending or descending order
•Ability to view current information in a graphical form
 Tip: On the graphs, the blue line represents the producer, the black line shows the provincial average, and the gray line indicates the provincial mean. Hover over the graph to view specific data points.
•Ability to export quality test results to an Excel format